|
An insight into predicting sales
behavior for the embedded systems market
by Ron Fredericks, last updated
October, 2007
ECI offers a community-based marketing service to companies that make or sell components and tools to the OEM device manufacturer and their related engineering support teams. Read on to learn some of the theory behind ECI's marketing techniques. Read ECI's marketing solutions-based article to learn more about increasing sales performance using ECI's marketing techniques.
Estimates of future sales depend on
the demand for the firm's products, and the strength
of the competition. Sales estimates would come from
the marketing department. Top management would provide
goals, targets, requirements, and plans. Production
would estimate product capacities and schedules. Accounting
would provide financial statements and accounting conventions.
The finance department would gather all the information
from these departments and create the sales forecast.
From this brief introduction to forecasting, a common
question is "how much should our company spend
on sales and marketing?"
Every marketing-mix strategy will lead
to a certain level of sales revenue. See tables 1 through
3 below for a practical example. The revenue data from
three public companies that develop operating systems,
development tools, run-time products, and services have
a wide range in budgets (sales/marketing and as a percent of total revenue). The bottom line is that companies
using a traditional direct sales approach can spend an
average of 40% of their total revenue executing their
sales and marketing strategy targeting the operating system market.
ECI offers a modern-day solution to this high cost of sales...
Table #1: Wind River's sales and marketing expense as a percentage of total revenue
Wind River
Public financial records (ref: Edgar's) |
Audit Period
2007 |
Audit Period 2006 |
| Total revenue (net in 1000's) |
$285,298 |
$266,323 |
| Sales and marketing expenses (in 1000's) |
$112,302 |
$95,301 |
| Cost of sales in percent |
39% |
36% |
Table #2: Red Hat's sales and marketing
expense as a percentage of total revenue
Red
Hat
Public financial records (ref: Edgar's) |
Audit
Period 2007 |
Audit
Period 2006 |
| Total revenue |
$400,624
|
$278,330
|
| Sales and marketing
expenses |
$145,562
|
$84,723
|
| Cost of sales in percent |
36%
|
30%
|
Table #3: Microsoft's sales and marketing expense as a percentage of total revenue
Microsoft
Public financial records (ref: Edgar's) |
Audit Period
2007 |
Audit Period 2006 |
| Total revenue (in million's) |
$51,122 |
$44,282 |
| Sales and marketing expenses (in million's) |
$11,455 |
$9.818 |
| Cost of sales in percent |
22% |
22% |
Note: Figures taken from corporate 10-K public filings, see Edgar's for more details.
In the three tables above, note how Wind River has the highest cost of sales. Red Hat has a lower cost and Microsoft has an even lower cost [of sales and marketing as a percent of total revenue]. There are several reasons for the differing levels of efficiency:
- Efficiency in marketing based on total revenue
- Efficiency in overlapping product mix between development tools and run-time components for desktop and embedded device platforms
- Efficiency in both marketing and sales as the result of an expanded online community corresponding to less direct marketing and sales
Embedded Components is dedicated to
researching new ways to optimize profit margins for
our clients. Optimizing the marketing and sales expenses
needed to achieve a desired revenue target is one the
business development services we offer.
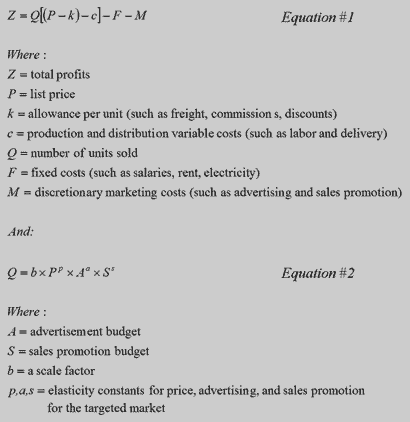
The goal of optimizing profits can be
summarized mathematically as follows (ref: Kotler):

Refer to the two equations listed above.
It is interesting to note that in equation #2, the forecasted
number of units sold Q, can be estimated using
elasticity constants which exponentially affect list
price P, advertisement budget A, and sales
promotion budget S. Each target market will tend
to have different values for these elasticity constants
but typical values might look like -2 for the list price
constant p, 0.15 for the advertisement budget
constant a, and 0.25 for the promotion budget
constant s. Embedded Components offers unique
and cost effective ways to leverage more value from
pricing tactics, advertisement strategies, and promotion
campaigns.
Embedded Components also offers an
engineering counseling service which can help reduce
a firm's variable costs (equation #1, variable c)
related to software development and hardware manufacturing.
Our company is unique because we have learned how to
bridge the knowledge gap between engineering professionals
and their business management counterparts. This often boils down to accelerating team maturity and leveraging a component-oriented architecture. Our company audit of your team might lead to suggested changes to your distributed test plans across
multiple hardware platforms, increased value through
documenting interfaces, or realized cost savings through
cooperative partner relationships.
Contact us to request more information
on how Embedded Components, Inc. can contribute to improving
your profit margins while lower your risks now...
References:
Edgar's SEC filings
http://www.sec.gov/edgar.shtml
FAQ by ECI's Ron Fredericks
FAQ Sales Performance Through Marketing
FAQ by ECI's Ron Fredericks
FAQ How to Approach a Gorilla Partnership
ECI's embedded components and tools marketplace, a distance learning initiative for users, makers, and enablers of embedded components
Learn how to use embedded components and tools
Marketing Management: Analysis,
Planning, Implementation, and Control by Philip
Kotler, published by Prentice Hall, Upper Saddle
River, New Jersey
|


